The median conversion rate of a campaign landing page is 6.6% (Unbounce, 41,000 pages, 2025). The conversion rate of an online store, measured in orders, is 1.7% for a new visitor (Contentsquare, 2026). Both figures are right. They do not measure the same thing, and that is the first thing to understand before comparing yourself to anyone.
Why the benchmarks contradict each other: campaign pages and store conversion do not count the same thing
Search for "landing page conversion benchmarks" and you will find, on the same results page, 6.6%, 2.35%, 5.13% and 8.18%. None of these figures is wrong. Unbounce measures a 6.6% median across 41,000 campaign pages, 464 million visitors and 57 million conversions, and a conversion there is almost always a submitted form. WordStream gets 8.18% across 13,474 US Google Ads campaigns between April 2025 and March 2026, as a median, with conversion defined by each advertiser. Ruler Analytics finds 5.13% across more than 5 million conversions and 110 million sessions in 2026, counting "a qualified lead or sale", forms and phone calls included.
And then there are orders. Contentsquare, across 99 billion sessions and more than 6,000 sites (March 2026 report), measures 1.7% conversion for a new visitor and 2.9% for a returning one, purchase included. Triple Whale, across 40,000 brands advertising on Meta between August 2025 and July 2026, reports a 1.53% purchase conversion rate after an ad click. A completed form and a paid order do not carry the same price, or the same rate. The first trap of benchmarks is reading a form median as if it applied to a store.
The 2026 reference points by traffic source
The source of the click moves the rate more than the design of the page. Unbounce, on its campaign pages, puts email first with a 19.3% average conversion rate, ahead of paid social (12%) and paid search (10.9%). Ruler, which counts qualified leads and sales on whole sites, partly reverses the order: paid search converts at 5.4%, email at 4.9%, and paid social drops to 2.11%. Contentsquare, in orders, gives paid search 2.8% and organic social 0.7%. Traffic from AI assistants, a newcomer to these reports, converts at 5.8% for Ruler and 1.3% for Contentsquare, up 55% in a year.
| Traffic source | Campaign page (F) | Site, lead or sale (L) | Store, order (O) |
|---|---|---|---|
| 19.3% (Unbounce) | 4.9% (Ruler) | not published | |
| Paid search | 10.9% (Unbounce); 8.18% Google Ads median (WordStream) | 5.4% (Ruler) | 2.8% (Contentsquare) |
| Paid social | 12% (Unbounce); 8.54% Meta leads campaigns (LocaliQ) | 2.11% (Ruler) | 1.53% Meta, 1.56% TikTok (Triple Whale) |
| Organic social | not published | 2.23% (Ruler) | 0.7% (Contentsquare) |
| Traffic from AI assistants | not published | 5.8% (Ruler) | 1.3% (Contentsquare) |
Read the paid social row. On a campaign page, 12% of visitors leave their details; in orders, 1.53% buy. The ratio is one to eight. Nowhere else is the gap between clicking on a promise and buying so wide, and it is precisely the source most ecommerce brands spend the most on. Email, by contrast, starts from an audience that already knows you: it converts well because the persuading was done before the click. We described what happens between the two in our diagnosis of TikTok Ads that get views but no sales.
The 2026 reference points by offer type
The second factor is what you ask of the visitor. The lower the commitment, the higher the rate, and that is mechanical. GetResponse, on its own customers in 2026, measures a 22.3% average conversion rate on webinar registration pages and 10.76% on list subscription pages. LocaliQ finds an 8.54% conversion rate on Meta leads campaigns in 2026, with an average cost per lead of $27.39. And at the far end, the paid order: 1.7% for a new visitor, 2.9% for a returning one (Contentsquare).
| Offer type | 2026 reference | What is counted |
|---|---|---|
| Webinar registration | 22.3% (GetResponse) | Sign-up (F) |
| List subscription, lead magnet | 10.76% (GetResponse) | Sign-up (F) |
| Meta leads campaign | 8.54%; $27.39 per lead (LocaliQ) | Form (F) |
| Recommendation questionnaire, ecommerce | 37.6% of visitors who start leave their details (Interact); 5.5% of those who finish order (RevenueHunt) | Details (F), then order (O) |
| Purchase in a store | 1.7% new visitor, 2.9% returning visitor (Contentsquare) | Order (O) |
The questionnaire row deserves a word, because it is the only one showing two rates. Interact, across its ecommerce store base in 2026, measures that 37.6% of visitors who start a questionnaire leave their details. RevenueHunt, across 45 million responses in more than 20,000 stores (2026), measures that 5.5% of those who finish place an order, roughly 2.75 times a typical store's rate. A questionnaire is therefore both a very good capture page and a path to the order. It is the only offer type in this table that does not stop at the form.
What moves the number, according to the data
Beyond source and offer, the reports isolate a few factors. Unbounce observes that pages written at a 5th-to-7th grade reading level convert at 11.1%, against 5.3% for professional-level writing, and that word count correlates negatively with conversion (−18.6%). The message is clear: a campaign page must read fast. Device matters too: Unbounce measures desktop converting 8% better than mobile, Contentsquare, in orders, 74% better, while mobile brings 83% of visits at Unbounce. And Contentsquare flags that conversion is receding: −7.9% year over year on desktop, −8% on mobile for new visitors. The median you compare yourself to is falling as you read it.
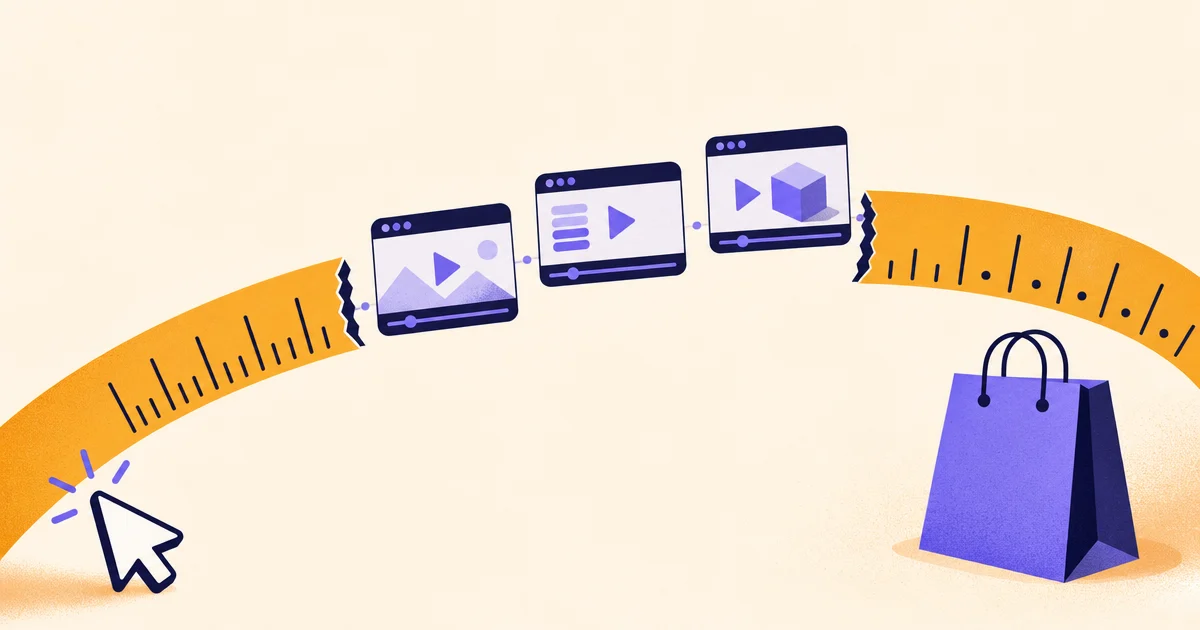
What the reports do not say has to be said here. None of them publishes a conversion rate for a single country, nor a figure that links, for the same visitors, the form completed on the campaign page and the order placed afterwards. We looked for that figure; it does not exist in the public reports of 2026. Yet it is the only one that matters to a brand buying traffic: how many of those who clicked ended up paying, and how many steps there were in between.
The missing reference: from click to order, and how the video funnel fills it
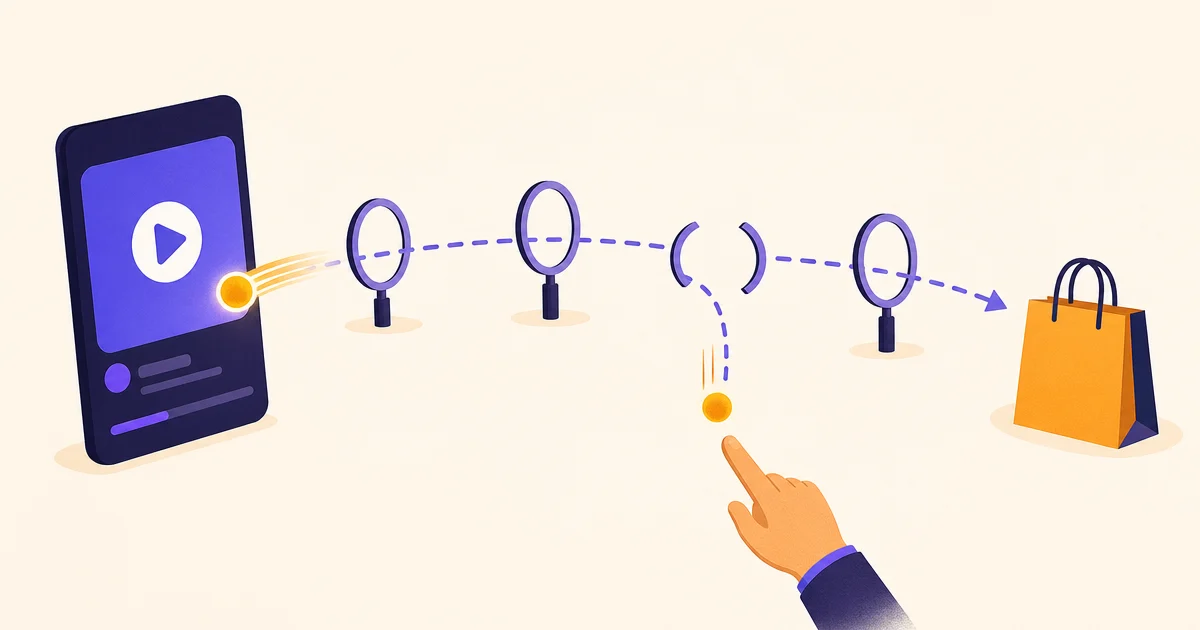
Take the one-to-eight ratio on paid social again: 12% forms, 1.53% orders. Between the two sits everything that goes unmeasured: the welcome email nobody opens, the generic follow-up, the return to the store where the visitor, alone, hesitates in front of the catalog. The campaign page did its job; it converted in Unbounce's sense. Then the sale got lost in a space nobody benchmarks.
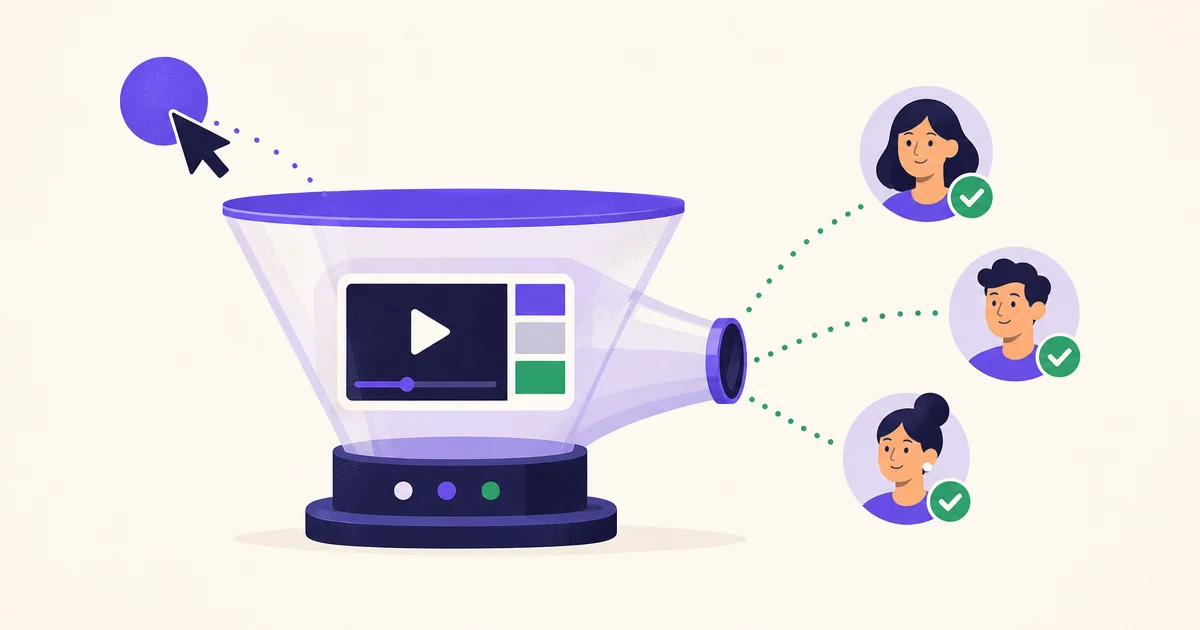
The video funnel is built for that space. Its campaign page is a questionnaire of 5 to 15 questions asked on video by the seller, and it converts like a capture page, with the reference points in the table above. But the visitor then receives, about two hours later, a personalized analysis video of 10 to 15 minutes, assembled from their answers, in which the seller, on camera, recommends one specific product and explains why. Then the follow-ups reuse their answers up to payment. There are no longer two unrelated rates, a form and an order, but a single sequence in which every step is measured.
BodyTime, which sells online fitness programs, replaced its setup with a 14-question VideoFunnel and a 13-minute video: on equal traffic, the funnel converts 2.5 times better than the previous path. Anna Velazia, a jewelry brand, puts 70% of its ad budget behind its funnel and gets a return on ad spend three times that of its other campaigns. Those are their figures, on their offers, not a market median. But they show where the game is played: not on the campaign page, which already converts well, but between that page and the order. It is the reasoning we developed in lowering your CAC without cutting your budget: before buying more clicks, extract the value of the ones you already pay for.
"My conversion rate is already above the median"
Above which median? If your campaign page converts at 9% in forms, you are above Unbounce's 6.6%, and that is good. But if 1.5% of your paid visitors buy, you are at Triple Whale's average, and the problem is not the page: it is what comes after. Most brands that call themselves above the median compare their best number to the most lenient reference. The honest exercise is to put the two rates side by side and look at the gap.
There is a second reason not to rest on a good median: it moves. Contentsquare measures conversion receding over a year, and Foundry CRO reminds us that only 17% of marketers actively test their landing pages. Those who improve are the ones who personalize what follows the click, an effect we quantified in our review of landing page personalization statistics. And the most complete personalization there is, is a video that answers what the visitor just declared.
The right conversion rate is the one that reaches the order
Landing page benchmarks are useful on one condition: knowing what they count. A 12% form rate on paid social is no victory if 1.5% buy afterwards; a 2.9% order rate is no failure if it comes from visitors who were advised first. The only figure that accounts for your ad money is the one linking the click to the order, and no report publishes it, because almost nobody builds the sequence that would allow measuring it.
The video funnel is that sequence. A campaign page that converts like a capture page, a personalized analysis video that does the salesperson's work, follow-ups that remember what the visitor said, a payment. Every step is measured, and the final rate no longer compares to a form median: it compares to what you sold before, on equal traffic. It is the only benchmark that belongs to you.
Frequently asked questions
What is the average landing page conversion rate in 2026?
The answer changes with what is counted. The median for campaign pages, measured in forms, is 6.6% (Unbounce, 41,000 pages). In qualified leads or sales, Ruler Analytics measures 5.13% (2026). In store orders, Contentsquare measures 1.7% for a new visitor and 2.9% for a returning one (2026). Always compare yourself to a reference that counts the same thing you do.
Which traffic source converts best on a landing page?
On a campaign page, email (19.3%), then paid social (12%) and paid search (10.9%), according to Unbounce. In orders, paid search leads (2.8%, Contentsquare) and paid social drops to 1.53% on Meta (Triple Whale, 2025-2026). The gap between form and purchase is widest on paid social.
What is a good conversion rate for an ecommerce store?
Contentsquare measures 1.7% for a new visitor and 2.9% for a returning one across more than 6,000 sites (2026); Triple Whale reports 1.53% after a Meta click and 1.56% after a TikTok click. Above 3% in orders on paid traffic, you are doing markedly better than the market.
How do you improve conversion between the landing page and the order?
By not leaving the visitor alone after the form. A video funnel chains a questionnaire campaign page, a 10-to-15-minute personalized analysis video in which the seller recommends one specific product, then follow-ups based on the answers. At BodyTime, that setup converts 2.5 times better than the previous path on equal traffic.